
Over on Geekzone Mauricio has posted page speed info for his website.
Here is similar information for Radio New Zealand.
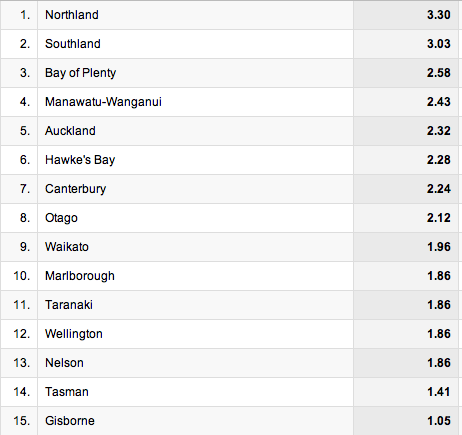
Average web page load time distribution in New Zealand:

All regions:
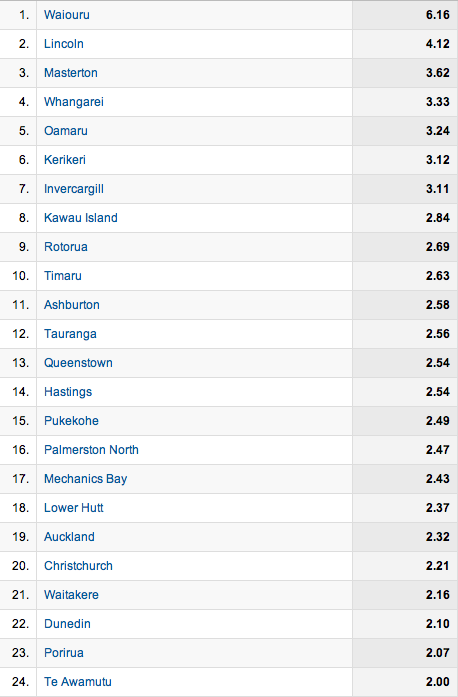
Slowest cities:
This is running on a server based at ICONZ running Rails 3.1.x.
The key thing we’ve done to make our site fast is reducing over-the-wire times by bundling assets, using compression where we can, and setting far-future headers for static content to ensure it can be cached somewhere else. The markup is also as clean as we can make it to ensure fast rendering.


Leave a comment